
Table of Links
3. SkyCURTAINs Method and 3.1 CurtainsF4F
5. Conclusion, Acknowledgments, Data Availability, and References
APPENDIX A: CurtainsF4F TRAINING AND HYPERPARAMETER TUNING DETAILS
A1. CurtainsF4F features preprocessing
4 RESULTS
The CurtainsF4F stage was trained on NVIDIA® RTX 3080 GPUs, and the Hough stage was run on a single CPU core. TheCurtainsF4F stage took ∼ 4 hours per patch, amounting to a total of ∼ 80 GPU hours. The CurtainsF4F stage consists of training a base and a top flow. Both base and top flow took ∼ 2 hours to train. The line fitting took about a minute per patch, and was a negligible fraction of the total computational cost.
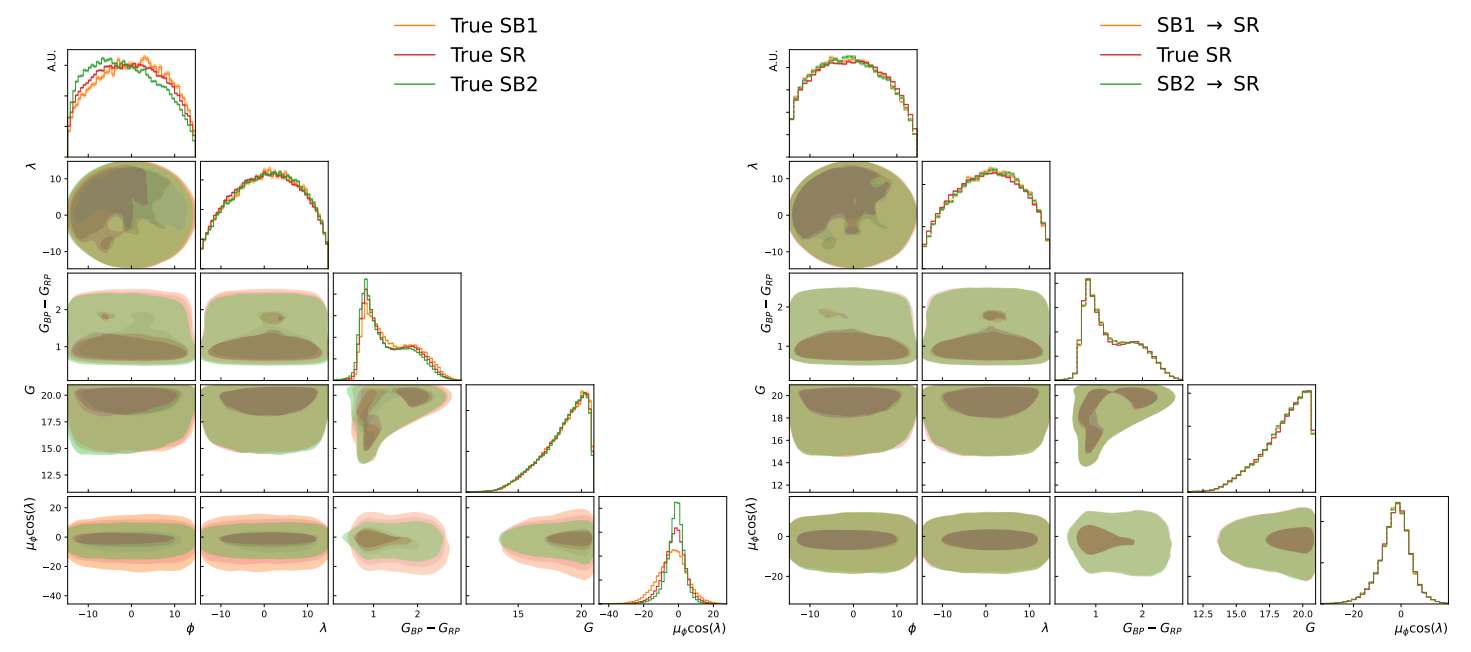
The most crucial step in the SkyCURTAINs method is the generation of a background enriched template in the signal region. In Figure 6, we show the marginals and correlations of features in the sidebands and signal region in the left panel. The features are strongly correlated with the proper motion, which would bias the classifier in the CWoLa step to produce false positives in the signal region even in the absence of a stream. In the right panel, we show the marginals and correlations of the features in the generated template by CurtainsF4F in the same patch. The generated template leverages the correlation of the features with the proper motion to construct a background enriched template in the signal region. This allows for a more representative template of the background in the signal region, and reduces the false positives in the search for stellar streams. With the generated template, we can now train a classifier in the CWoLa step to tag the stars in the signal region.
4.1 Metrics
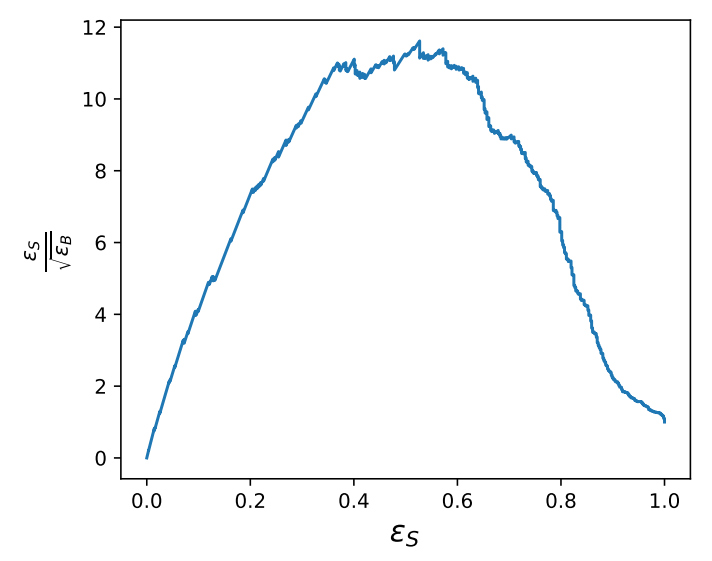
We now demonstrate the performance of the SkyCURTAINs method on GDR2 data. To quantify the discovery potential of SkyCURTAINs method, we measure the Significance Improvement Characteristic (SIC) curve for the GD-1 stream. In Figure 7, we show the SIC curve as a function of the signal efficiency for the GD-1 stream in one of the 21 patches. This metric is defined as the ratio of the signal efficiency to the square root of the background efficiency, and essentially quantifies the improvement in the discovery significance of the signal from the method. SkyCURTAINs achieves a maximum significance improvement of ∼ 10 at ∼ 50% signal efficiency. Although a direct comparison with Via Machinae is difficult on account of different SR being used for the analysis, one can look at the maximum value of the SIC as a heuristic measure, which are comparable for both methods.
We track two other metrics to quantify the performance of SkyCURTAINs: purity 𝑝: The fraction of candidate CurtainsF4F
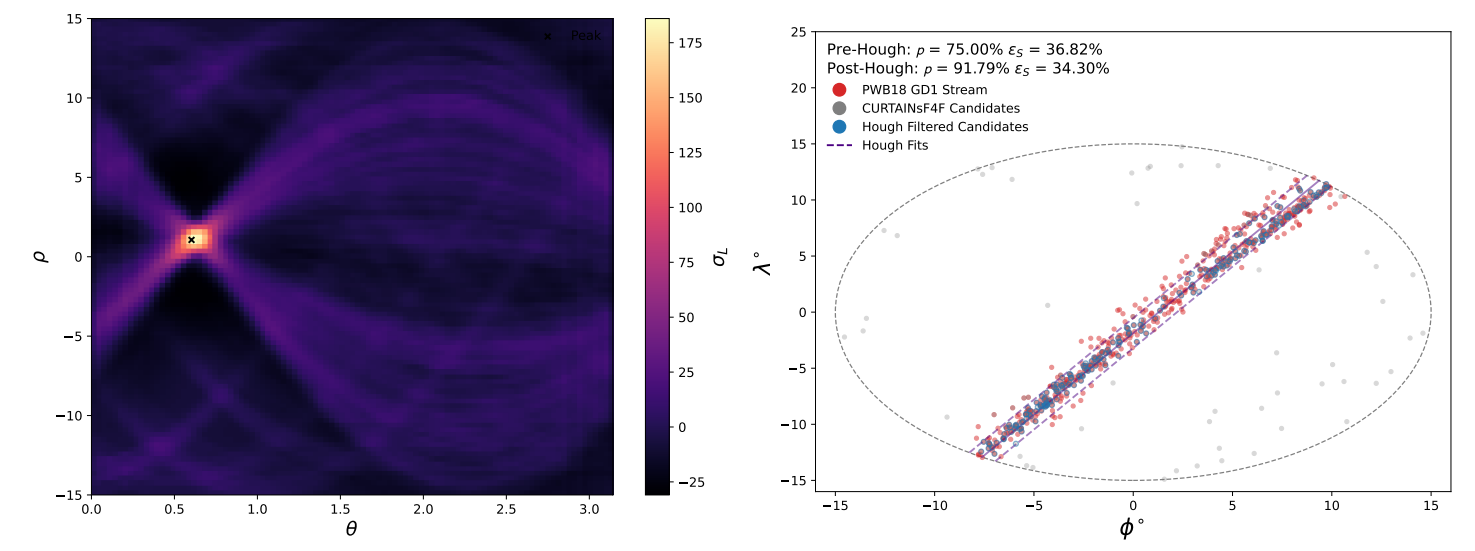
stars that overlap with the PWB18 identified GD-1 stream members; and signal efficiency, 𝜖𝑆 which is the fraction of GD-1 stream members that have been flagged as candidates by CurtainsF4F step. Figure 5 (right) shows the candidates from the CurtainsF4F step in the 𝜙-𝜆 space that corresponds to the GD-1 stream with a 𝑝 = 75% and 𝜖𝑆 = 36.82%. We note that it also predicts a few stars that do not form a line like structure in the 𝜙-𝜆 space. This is expected, as this stage is designed to flag any overdensity in the feature space as a potential signal candidate. To filter out the line like overdensities we perform a Hough transform on the output of CurtainsF4F step. After applying the Hough filter, the purity is improved to 91.79%, albeit at the cost of a slightly reduced signal efficiency of 34.3%.
4.2 Full GD-1 stream scan
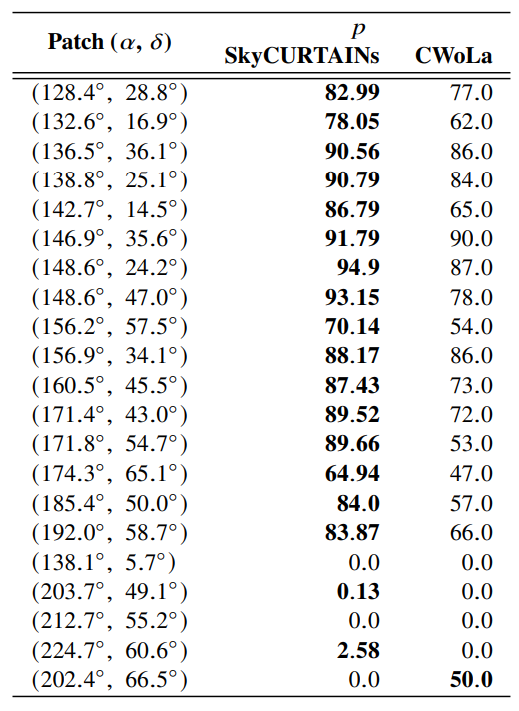
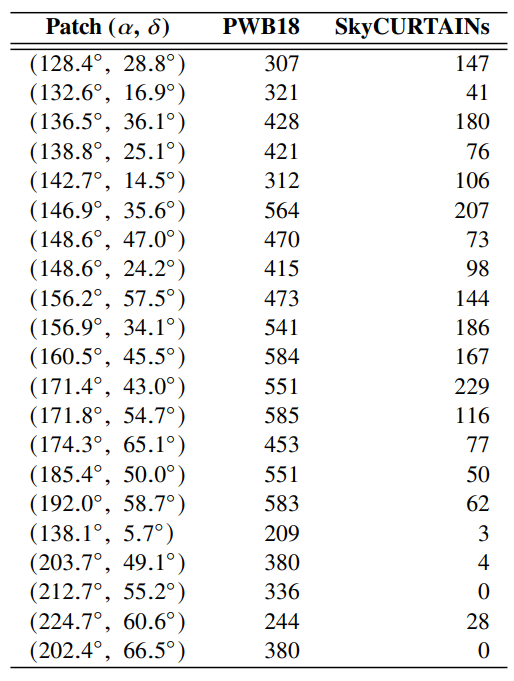
Table 1 shows the performance of the SkyCURTAINs method in the 21 patches that contain the GD-1 stream. We quote the purity 𝑝 after applying the Hough filter for each patch. SkyCURTAINs is able to identify the GD-1 stream members with a high purity in most of the patches, and significantly improves the performance compared to standalone CWoLa. In Table 2 we report the total PWB18 identified GD-1 stream members and SkyCURTAINs candidates (after Hough filter) in the patches. The combined result is shown in Figure 8.
SkyCURTAINs has a very low purity in 5 of the 21 patches of the sky where the GD-1 stream is present. On closer inspection we find that in patches (𝛼, 𝛿) = [(203.7 ◦ , 49.1 ◦ ) , (212.7 ◦ , 55.2 ◦ ) , (224.7 ◦ , 60.6 ◦ ) , (202.4 ◦ , 66.5 ◦ )], the GD-1 stream members peak at very low proper motion (𝜇𝜆). This results in a SR that is dominated by distant stars, and the sensitivity of the CurtainsF4F step to actual stream stars is reduced. These patches correspond to 𝜙1 ⩾ −10◦ in the GD-1 stream aligned coordinates, which explains the low yield of the SkyCURTAINs method to the right of the stream in Figure 8. SkyCURTAINs also has a low purity in the patch centred at (𝛼, 𝛿) = (138.1 ◦ , 5.7 ◦ ). The low GD-1 stream purity in this patch is likely due to the extremely
low signal to background ratio in the corresponding SR. In Figure 9 we show the GD-1 stream purity as a function of the PWB18 signal to background ratio. We find the purity has a sharp drop to zero when the signal to background ratio is near 0.01%. Patch (𝛼, 𝛿) = (138.1 ◦ , 5.7 ◦ ) has a signal to background ratio of 0.01%, which is the lowest in the 21 patches. This patch corresponds to −80◦ ⩽ 𝜙1 ⩽ −60◦ in the GD-1 stream aligned coordinates, and explains the low yield of the SkyCURTAINs method to the left of the stream in Figure 8. These patches (marked in red) are the patches where the GD-1 stream members peak at very low proper motion (𝜇𝜆), and the sensitivity of the CurtainsF4F step to actual stream stars is reduced. This patch corresponds to −80◦ ⩽ 𝜙1 ⩽ −60◦ in the GD-1 stream aligned coordinates, and explains the low yield of the SkyCURTAINs method to the left of the stream in Figure 8.
It is crucial to note that SkyCURTAINs method assumes very little astrophysical information about the stream, allowing it to be agnostic to the stream’s properties. The only information used in the method is the proper motion which is used to define the SR and SB
regions. For stream identification, fiducial cuts on 𝐺BP −𝐺RP and 𝐺 (there no requirements on streams to lie on an isochrone) are applied. This is in parity with the fiducial cuts applied in (Pettee et al. 2023; Shih et al. 2021). SkyCURTAINs flags 753 unique stars as potential GD-1 stream members, of which 568 are also identified by PWB18, thereby attaining an overall GD-1 stream purity of 75.4%. This surpasses the standalone CWoLa method which has a purity of 56%, and Via Machinae 1.0 which has a purity of 49%. SkyCURTAINs also outperforms Via Machinae 2.0, which has a purity of 65%, despite the latter employing additional fiducial cuts and performs an augmented scan over both proper motions. There are 1498 PWB18 identified GD-1 stream stars in our fiducial region, which gives us a global signal efficiency of 37.9%. Furthermore, an important result of the SkyCURTAINs method is that it produces no spurious streams in the 21 patches that were scanned. This can be attributed to the very stringent selection criteria applied in the CurtainsF4F stage of the method, designed to reduce false positives.
Of the remaining 185 stars, some may potentially be new undiscovered members of the GD-1 stream. Figure 10 shows the isochrone plot for the GD-1 stream members identified by PWB18, with the additional SkyCURTAINs candidates overlaid. There is a significant overlap between these 185 stars and the PWB18 labelled members, which suggests that the SkyCURTAINs method is able to identify some members of the GD-1 stream that may have been missed by PWB18. There are also a few stars that are not part of the GD-1 stream isochrone, and are likely to be false positives.
Despite the lack of prior astrophysical information, the SkyCURTAINs method is able to recover well known density perturbations in the GD-1 stream. In the GD-1 stream stream aligned coordinates (𝜙1, 𝜙2) (Koposov et al. 2010) shown in Figure 8, we see that SkyCURTAINs recovers the "gaps" at 𝜙1 ≈ −40◦ and 𝜙1 ≈ −20◦ , as well as the "offshoot" or "spur" at 𝜙1 ≈ −35◦ , which are well known features of the GD-1 stream. Furthermore, SkyCURTAINs predictions of the overdensity regions at 𝜙1 ≈ −50◦ and 𝜙1 ≈ −10◦ are in good agreement with the PWB18 members. The low yield regions at 𝜙1 ⩾ −10◦ and −80◦ ⩽ 𝜙1 ⩽ −60◦ are due to the reasons discussed above. The region 𝜙1 ⩽ −80◦ correspond to the patches that are excluded from the analysis due to their proximity to the galactic disk.
Authors:
(1) Debajyoti Sengupta, Département de physique nucléaire et corpusculaire, University of Geneva, Switzerland ([email protected]);
(2) Stephen Mulligan, Département de physique nucléaire et corpusculaire, University of Geneva, Switzerland;
(3) David Shih, NHETC, Dept. of Physics and Astronomy, Rutgers, Piscataway, NJ 08854, USA;
(4) John Andrew Raine,, Département de physique nucléaire et corpusculaire, University of Geneva, Switzerland;
(5) Tobias Golling, Département de physique nucléaire et corpusculaire, University of Geneva, Switzerland.
This paper is